In the first part of this lab, we were instructed on how to properly form a table and input coordinate data value in Microsoft excel. We then converted the constituents of minutes, degrees, and seconds into decimal degrees.
In the second part of the lab we were tasked with creating a map displaying the location of every university, high school, middle school, elementary school, and combination school for Manatee County, Florida. We acquired the raw address data for each school from Florida's Department of Education website and TIGER line shapefiles and county boundaries from the United States Census Bureau. The address data was copied into excel where we then cleaned it up so it could be read as a data and properly geocoded in ArcGis. It was all relatively simple and a good brush up on using excel.
We imported both of our census layers into our new map in ArcGis Pro and then changed their projection to NAD1983 (2011) Harn State Plane Florida West FIPS 0902 Feet. Once our projections were changed and matched, we went to the attribute table for our county boundaries, selected manatee county, and exported it as an individual layer. In our geocoding totoolbox, we then created an address locator. However, with the new updates to ArcGisPro this was renamed Create Locator pane, so this took a little bit of time to ensure the inputs were consistent with the instructed Address Locator. I believe it was just a name change.
We input our TIGER line layer and had it create this locator with street addresses. This would then give us a locator, which is not saved in the database, for Manatee county that would coordinate with our geocoding. Naturally, the next step was to go to our table of addresses and geocode them.
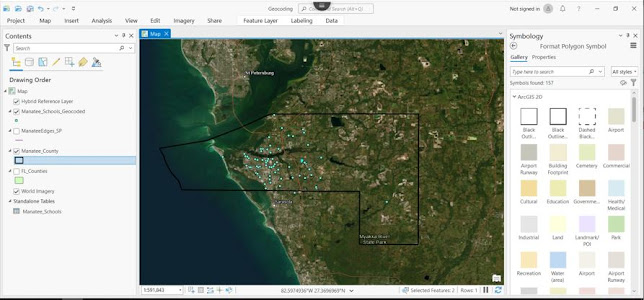
These were my results after placing a dark yet hollow boundary around the county and an satellite base map below my data:
This was a rather simple process, however, once the program has completed running, it will display results of which addresses were properly geocoded and which ones were not. Unfortunately, I had eight that were not. In order to rectify this, we were instructed to put a new base layer in our map, in this case it was satellite imagery, which we could then match up buildings with in Google Maps. Though tedious, I must admit this part was rather fun. An interesting aside, is that several of the addresses were in the building stages during the ArcGis supplied base layer versus their being complete in the Google Maps imagery. The reason for this inability to properly locate addresses was not caused by any corruption or poor display of the data, it was due to variables that seem to get missed when importing a large amount of data. This was that the addresses, though correct, would be to a P.O. Box representing the school or a school that may be in the county district but not actually be geographically in the county boundary. Also, one of the schools, which hadn't been finished in the ArcGis imagery, had a mailing address to a headquarters far outside of the county. Once again, these are issues that you have to troubleshoot when importing large volumes of data.
Once the map was corrected, I removed the satellite layer, shaded in my county boundary with a transparent light grey, changed the colors of my points, and uploaded it to ArcGis Online.
You can view mine here:
https://arcg.is/XjDaz
https://arcg.is/XjDaz

Comments
Post a Comment